Improving Fleet Management Through Intuitive Design
Role
Interaction Designer
Timeline
October 2021 - February 2022
Tools
Figma, Miro, Trello
Deliverables
8 Feature concepts, 4 User flows
Overview
This program was a 4-month design support track that was part of a longer 1.5-year engagement. This track involved design reviews, experience walkthroughs and feature development to leverage updated edge compute capabilities. The target users for the product are fleet and logistics managers, drivers, and 3rd party logistics providers. The UX design support team worked with the client to create wireframes and prototypes of the platform, testing and iterating on the design with users to ensure that it is easy to use and efficient. We also provided guidance on user interface and interaction design to aligning the design with the client's business goals and objectives.
Revolutionizing Fleet Management
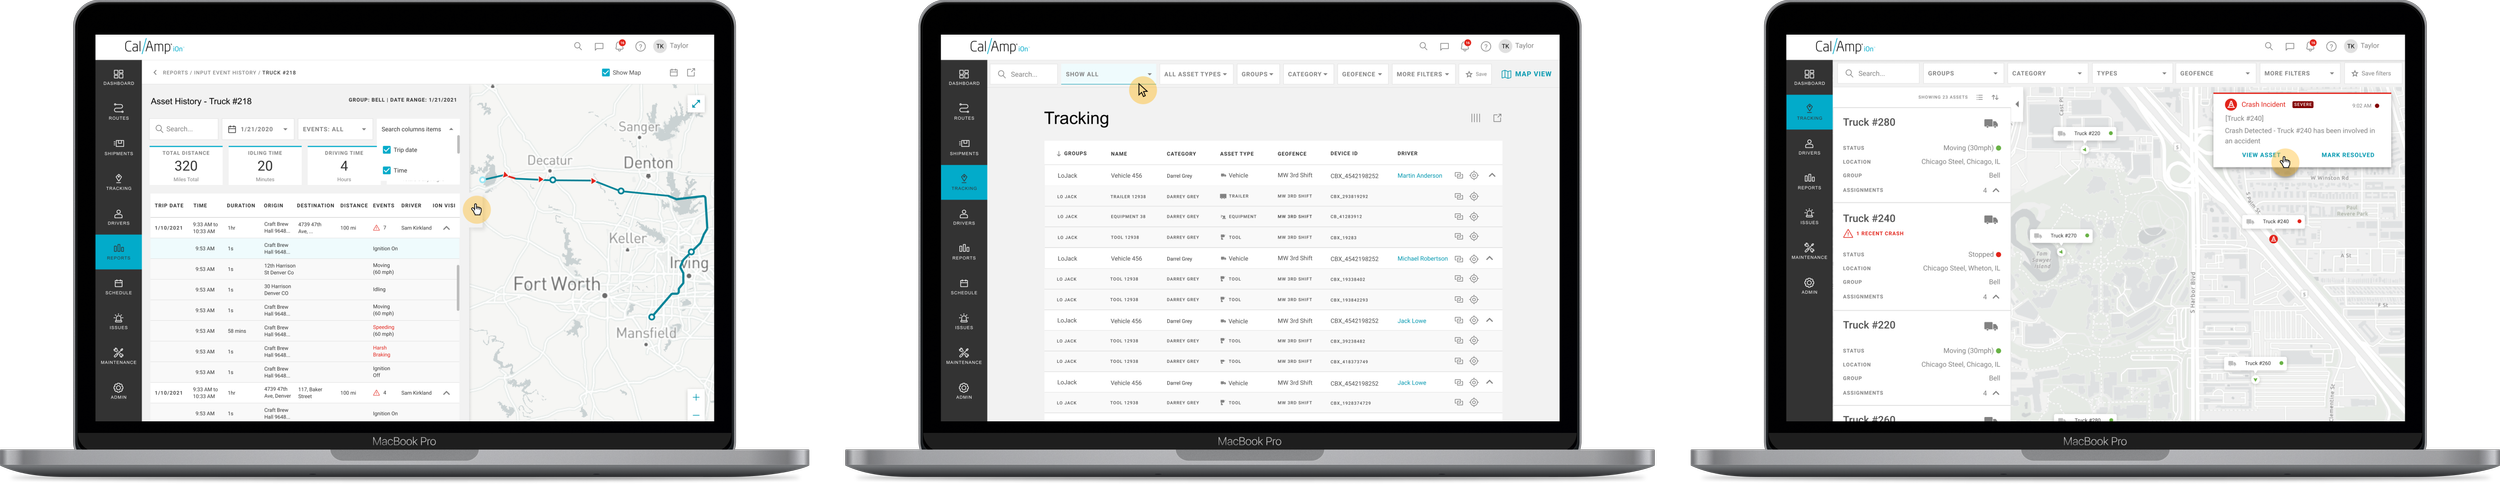
CalAmp is one of the longest-standing players in telematics, powering millions of connected vehicles, trailers, and assets across enterprise fleets. As competitors introduced faster diagnostics, clearer reporting, and more modern UX patterns, several of CalAmp’s most essential workflows were becoming too slow, too ambiguous, and too fragmented. Fleet operators were spending too much time interpreting data and not enough time making decisions in high-pressure situations.
CalAmp’s leadership engaged our team to reimagine four high-impact product areas: Crashboxx, Asset Tracking, Smart Trailer, and EV Monitoring. The goal was to create a more decisive, predictable, and insight-driven fleet management experience.
I served as the Interaction Designer responsible for workflow analysis, interaction modeling, and feature-level redesign. I collaborated daily with PMs, data scientists, firmware engineers, and operational SMEs to ensure that every proposed solution respected ingestion limitations, sensor variability, and the real pressures that fleet operators face.
My Role and Responsibilities
I led interaction design across Crashboxx, Asset Tracking, Smart Trailer, and EV Monitoring. My responsibilities included:
• Mapping user workflows and interviewing internal SMEs
• Identifying frictions and gaps in telemetry data interpretation
• Designing new interaction models grounded in ingestion timing and sensor cadence
• Facilitating feasibility reviews with engineering and firmware teams
• Producing flows, prototypes, UX acceptance criteria, and documentation
• Aligning interface components with CalAmp’s design system
• Supporting leadership reviews with clear rationale and decision tradeoffs
This ensured that design, engineering, and product leadership shared a unified vision of feasibility, clarity, and long-term scalability.
The Challenge
Telematics succeeds when it transforms raw sensor output into fast and confident decisions. Through our discovery work, we surfaced four core friction points that slowed operators down:
Crash events took too long to interpret and act on
Asset visibility was inconsistent and often misleading
EV insights lacked narrative context
Preventative maintenance signals were buried
These issues were not caused by missing data. They were caused by how information was surfaced, structured, and interpreted.
Constraints We Had to Design Around
Early reviews with engineering, firmware, and operations uncovered several critical constraints that shaped the direction of the redesign.
Ingestion Lag and Sensor Cadence
Crash signals, accelerometer spikes, BLE beacons, and reefer data all update at different intervals. The experience needed to remain trustworthy even when data arrived unevenly or with slight delay.
Firmware Variability Across Devices
CalAmp’s ecosystem includes multiple hardware generations, each with different sensor accuracy and sampling frequencies. The interface needed to adapt to these variances gracefully.
Environmental Interference
GPS drift, metal obstruction, and limited cellular coverage introduced unavoidable ambiguity. The UI had to communicate confidence without overwhelming operators with technical detail.
Operator Cognitive Load
Fleet managers juggle dispatch systems, radios, calls, and multiple screens. The new interaction patterns had to reduce complexity and make interpretation near-instant.
Legacy UI and System Architecture
Existing component patterns were not designed for predictive or insight-driven workflows. We needed to evolve them without disrupting existing mental models.
These constraints became guardrails that informed every design decision.
What Was Broken and Why It Mattered
Crashboxx
Crash events were difficult to interpret, and severity was unclear. Operators needed a simpler and more reliable way to understand what happened and what to do next.
Asset Tracking
Assets frequently appeared missing because the system evaluated location without understanding expected behavior. Operators were forced into manual verification loops that slowed down operations.
EV Monitoring
Battery, range, and charging information appeared as disconnected data points. Fleet leaders needed a way to understand patterns, exceptions, and narrative context.
Maintenance
Signals were not prioritized well. Operators often discovered issues too late because alerts remained buried in low-visibility screens.
All of these issues contributed to slower decisions and higher operational risk.
The Aha Moment That Shifted Everything
A breakthrough came from CalAmp’s support and operations teams. They explained that a large number of “missing asset” tickets reported by customers were not caused by theft or actual loss. They were caused by the platform misinterpreting normal asset movement.
One SME summarized the issue clearly:
“Most of these assets are not missing. The system simply does not know what they are supposed to be doing.”
This exposed a deeper problem. The platform was using a binary here-or-not-here model that failed to reflect the dynamic and fluid nature of fleet operations.
Once we understood this, the direction shifted. The interface needed behavioral context, not more data. Operators needed explanations, not just coordinates. Alerts needed confidence indicators instead of simple labels.
This insight opened the door to:
• The expected versus actual behavior model
• A new asset state taxonomy
• Breadcrumb histories that explained why an asset appeared out of place
• Confidence indicators that surfaced GPS drift or lag
This alignment across product, engineering, and data science shaped every major design decision that followed.
Designing for Speed, Safety, and Certainty
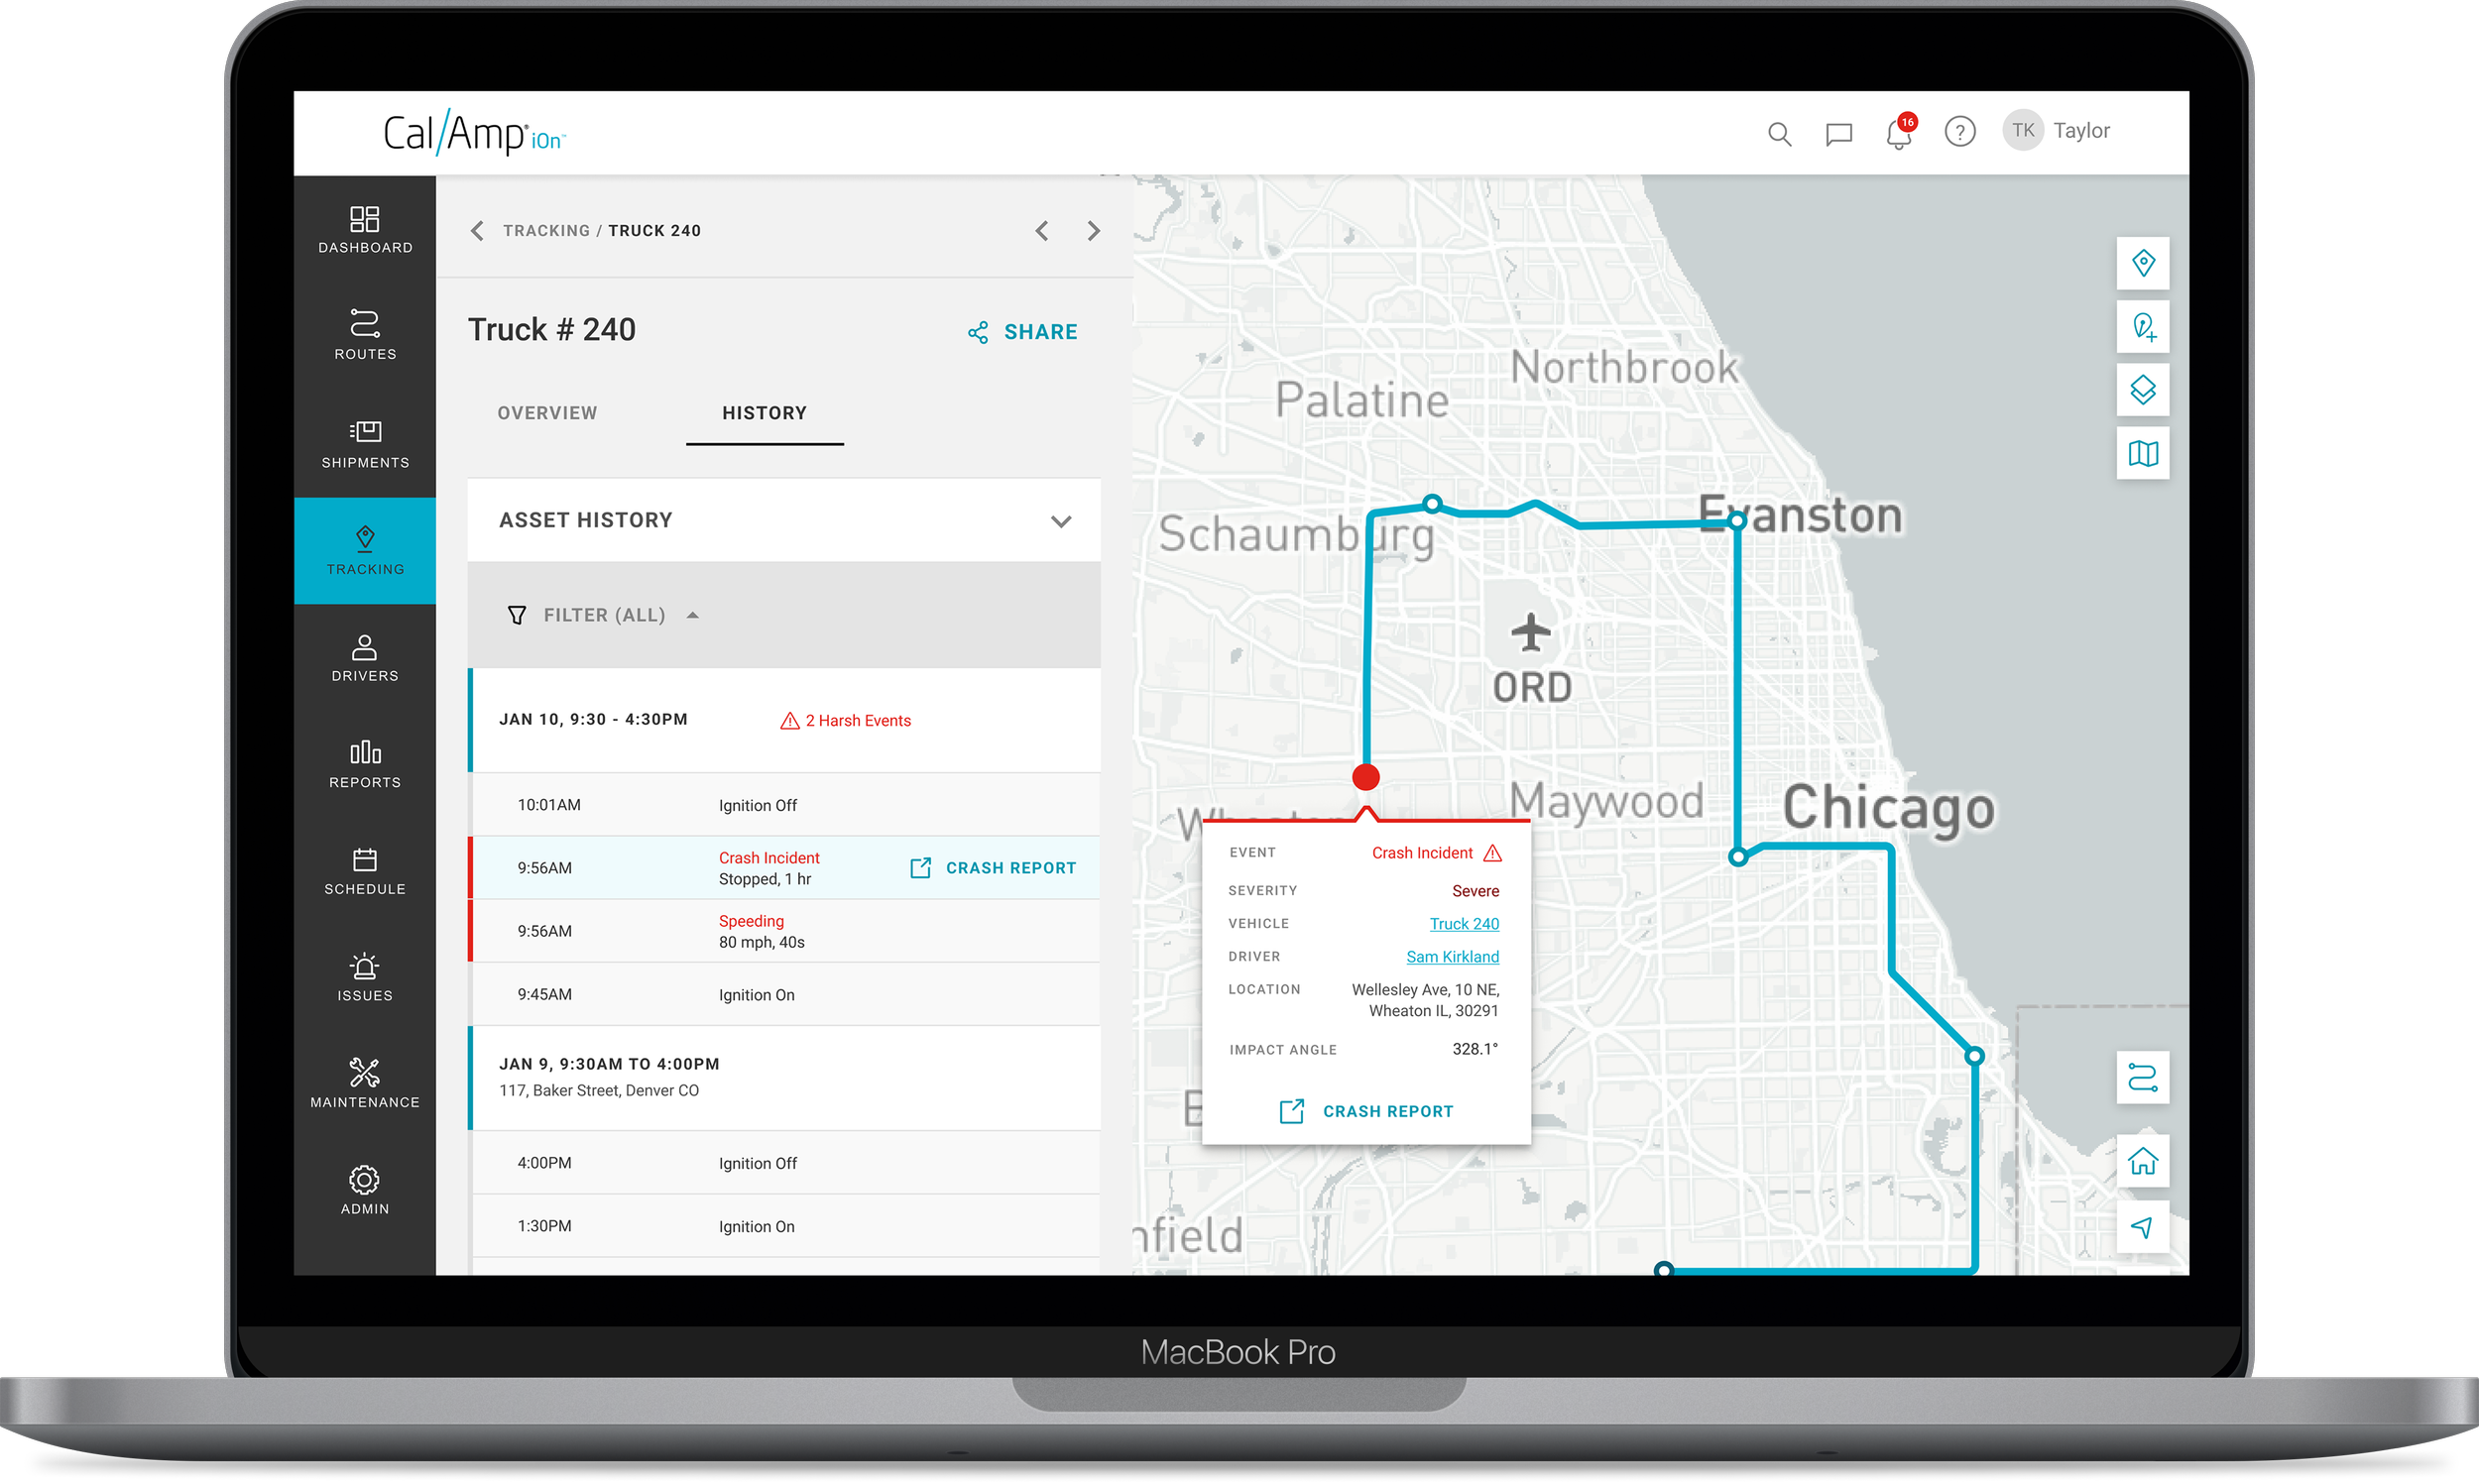
Crashboxx
The redesign centered on a clear lifecycle: trigger, verification, severity interpretation, and recommended action. Working with data science, we mapped accelerometer and g-force signatures into severity tiers so operators could understand the situation in seconds.
Smart Trailer
We created a unified Live Conditions view that provided temperature, humidity, and door status while accommodating varying firmware update intervals. Operators could finally interpret trailer conditions at a glance.
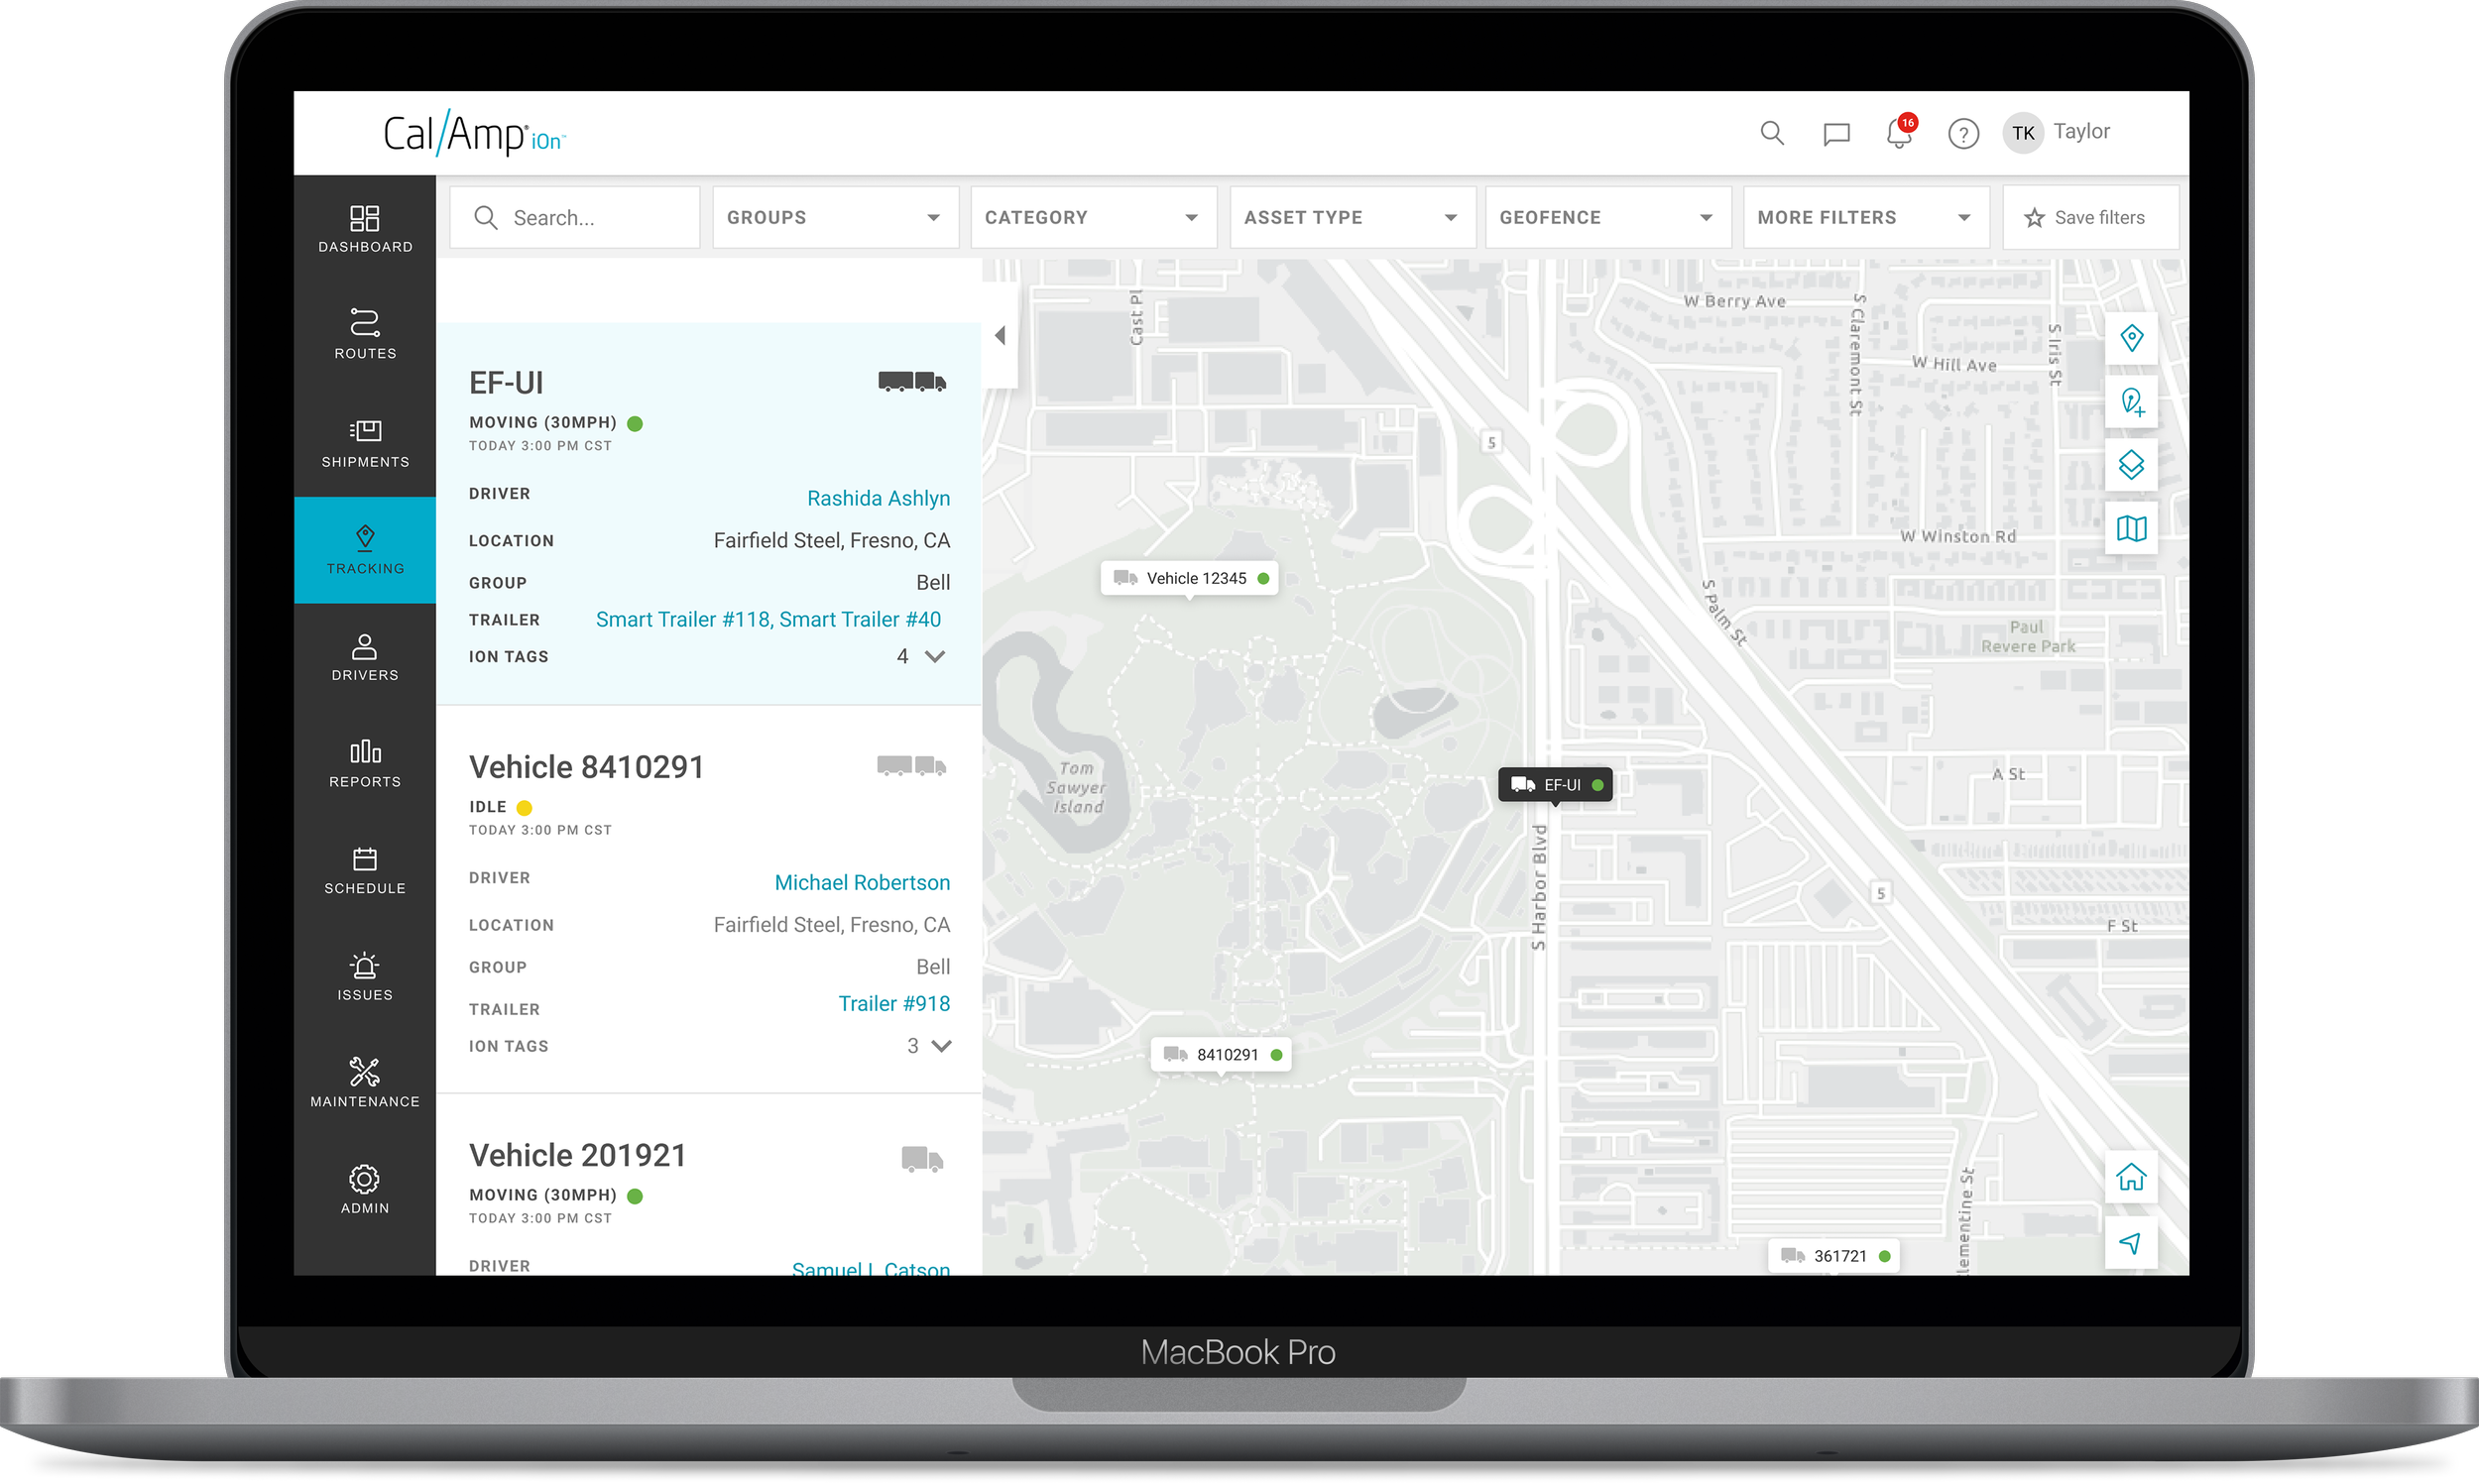
Asset Tracking
We introduced behavioral states such as assigned, in transit, at job site, idle, and unexpected location. This reduced false alerts and helped operators focus on true exceptions.
Platform Consistency
We standardized card layouts, severity patterns, IA groupings, and insight surfaces. This reduced cognitive load and created predictable interaction patterns across the system.
Outcomes
Directional analysis from moderated testing and operator walkthroughs showed clear improvement:
• Crash triage time decreased by an estimated 35 to 45 percent
• Asset state identification accuracy improved by roughly 20 to 30 percent
• False-positive crash dismissals became significantly faster
• Trailer utilization and reassignment decisions improved
• EV insights were consistently described as clearer and easier to interpret
• Cross-platform consistency reduced onboarding friction for new users
These outcomes helped leadership validate both the feasibility and the strategic value of the redesign.
Reflection
Designing for telematics means designing for real-world ambiguity and imperfect data. The work required understanding ingestion delays, sensor cadence, signal reliability, and the pressure operators face every time an alert appears.
Close collaboration with CalAmp’s PMs, engineers, data scientists, and internal operations specialists allowed us to build solutions grounded in operational reality. The final direction gave fleet managers a more confident and predictable experience during the moments where clarity matters most.
other work.
-
![]()
Big League AI
-
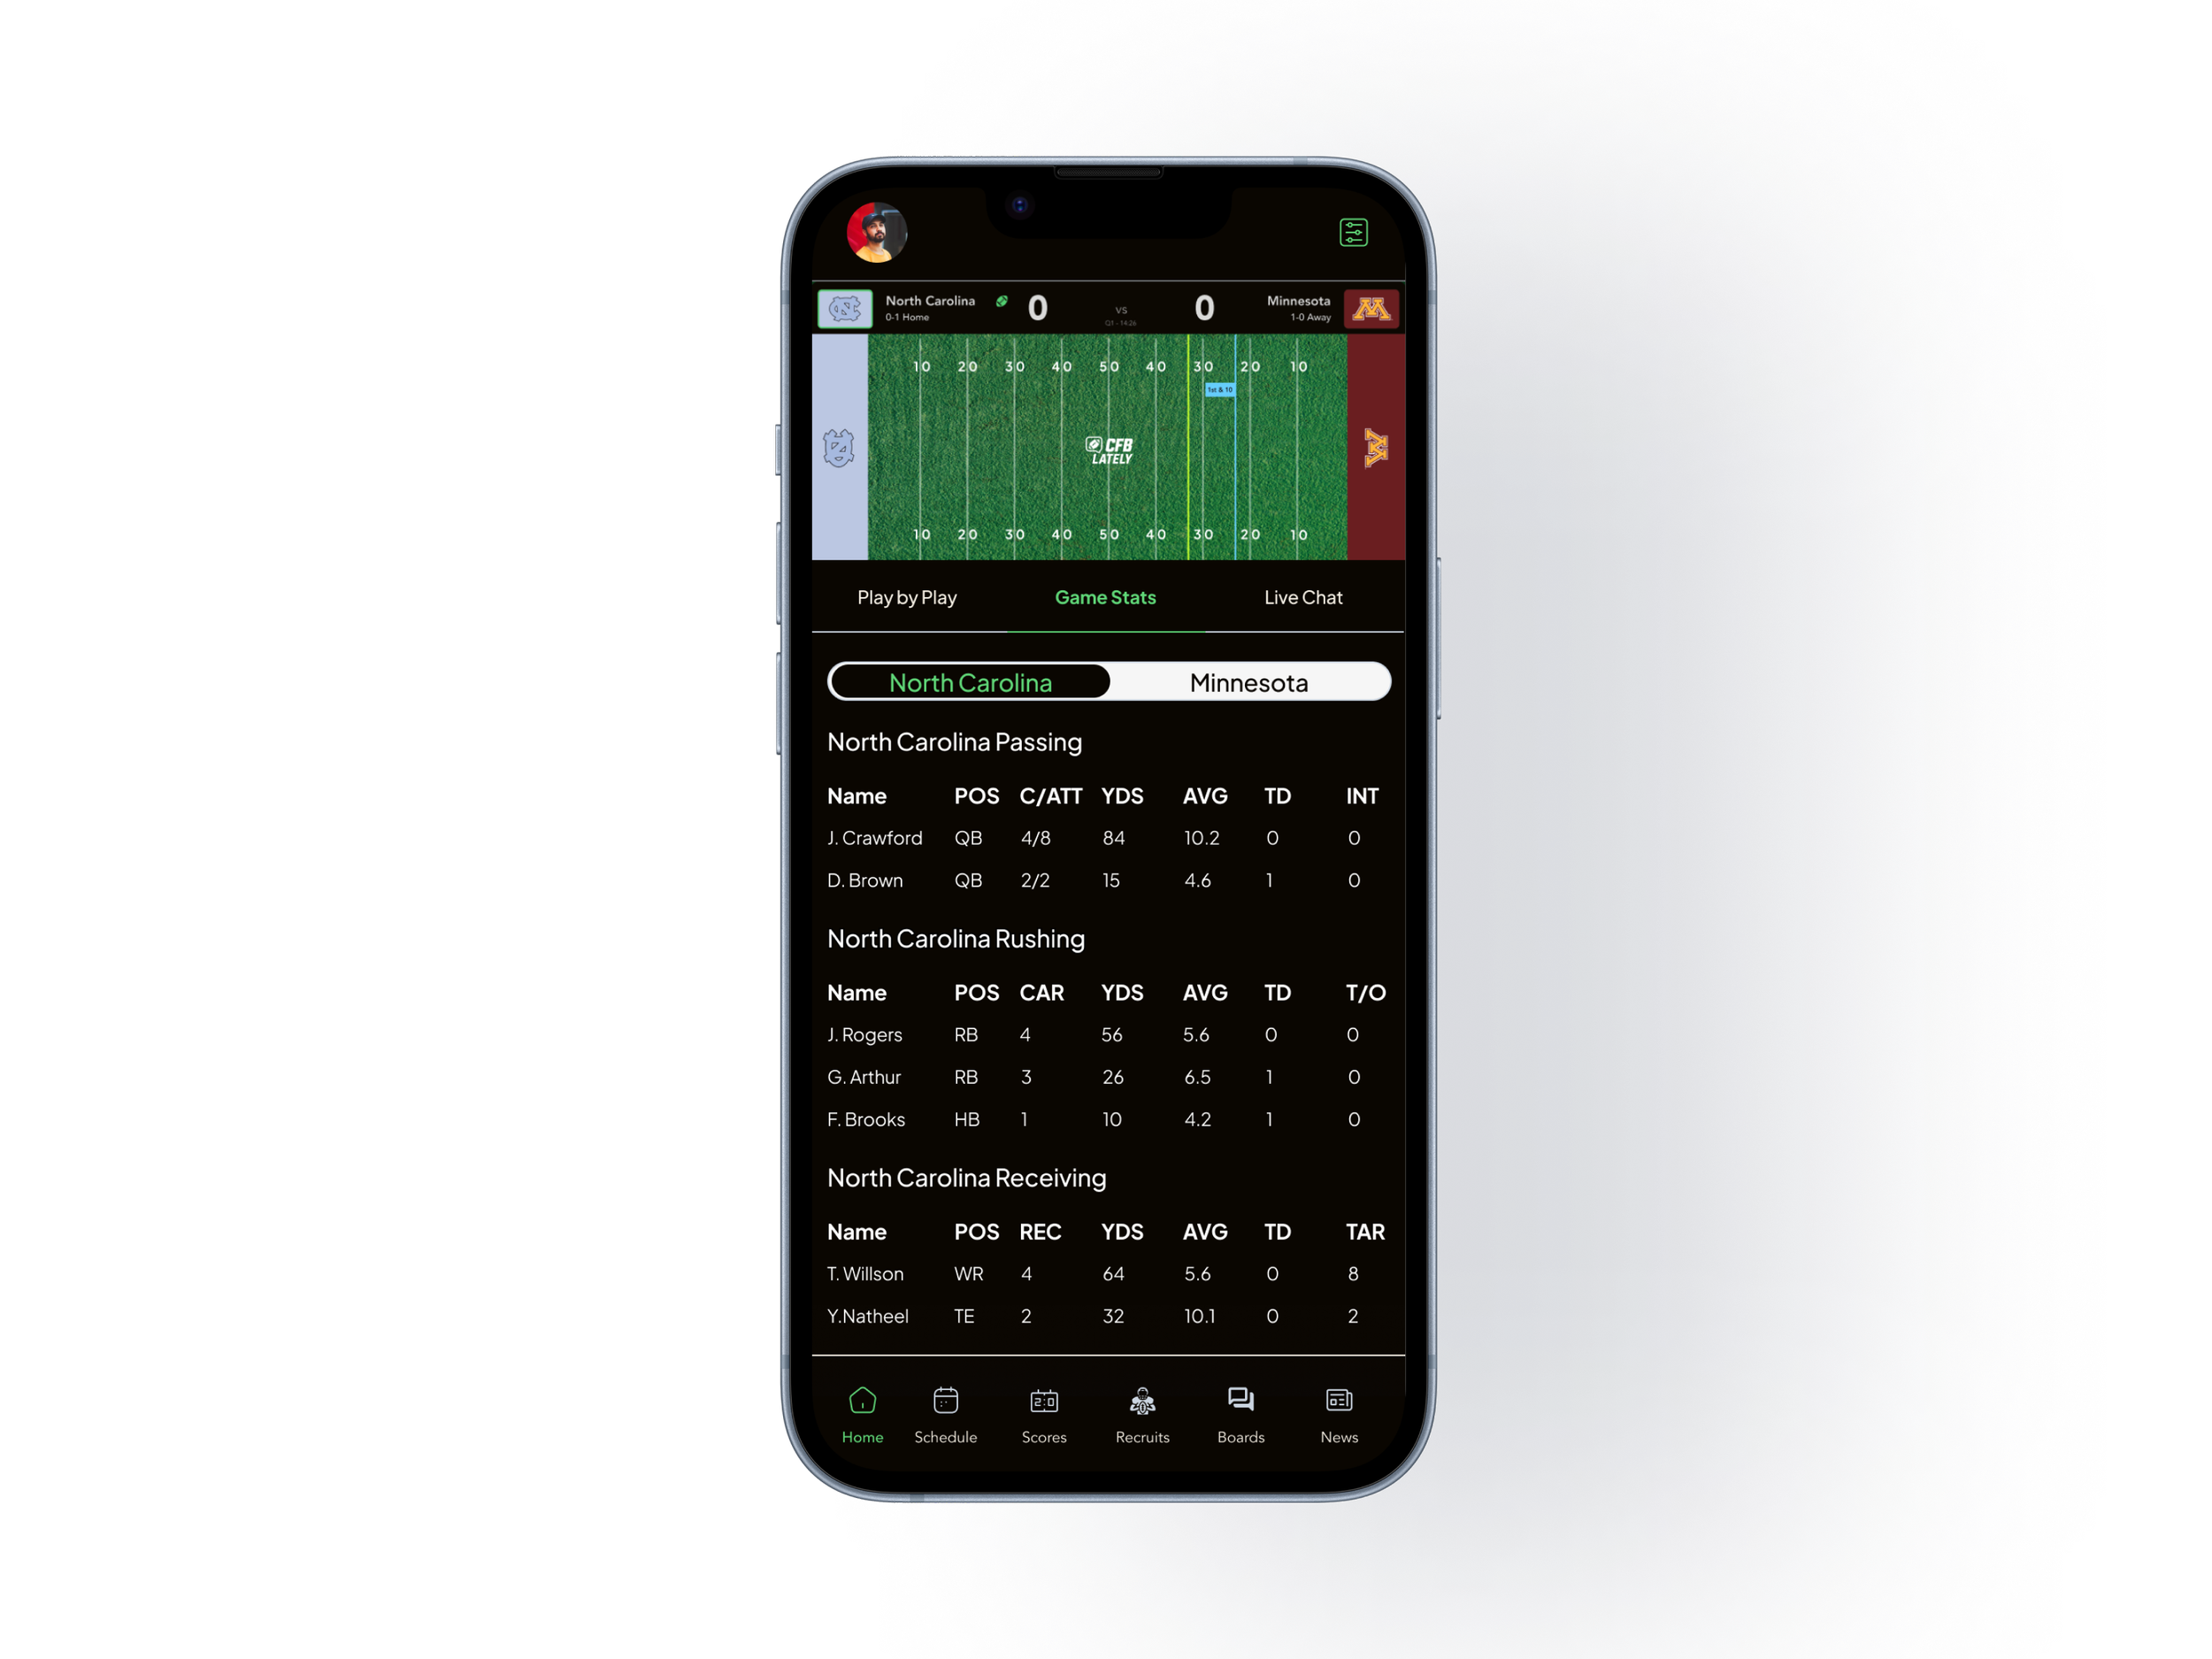
![]()
CFB Lately
-
![]()
Powerful Web
-
![]()
Franklin Templeton
-
![]()
Fluidra